

Please use this identifier to cite or link to this item:
http://www.alice.cnptia.embrapa.br/alice/handle/doc/999072| Title: | Application of multivariate methods to evaluate fatty acids in soybean cultivars. |
| Authors: | OLIVEIRA, M. C. N. de  CARRÃO-PANIZZI, M. C. MANDARINO, J. M. G. |
| Affiliation: | MARIA CRISTINA NEVES DE OLIVEIRA, CNPSO; MERCEDES CONCÓRDIA CARRÃO-PANIZZI, CNPT; JOSÉ MARCOS GONTIJO MANDARINO, CNPSO. |
| Date Issued: | 2014 |
| Citation: | In: INTERNATIONAL BIOMETRIC CONFERENCE, 27., 2014, Florence. [Abstracts...]. Washington, DC: International Biometric Society, 2014. |
| Description: | Increased consumption of soyfoods and the world's health problems related to high cholesterol levels, justify surveys to assess levels of fatty acids in soybean grains. Soybean presents high concentration of essential unsaturated acids (oleic, linoleic, and linolenic). In this work, contents of protein, oil and the fatty acids, palmitic (16:0), stearic (18:0), oleic acid (18:1?9c), linoleic acid (18:2?9c,12c) and ?-linolenic acid (18:3?9c,12c,15c) were determined in seeds of 235 Brazilian soybean cultivars, which were analysed and classified as high, medium, low and very low content of fatty acid. All these variables were standardized to an average equal to zero and variance equal to one. For this study, it was use, 50 cultivars with high content of fatty acids. To evaluate the seven responses variables, Principal Component Analysis (PCA) method was applied and a linear combination that measures total variation of the variables, Cluster Analysis (CA), biplot graphic, and communality, were considered. Based on a Singular Value Decomposition (SVD), biplot method permits to present in the same graph, response variables and treatments, indicating the contribution of both according to its components. The exploratory analysis do not indicated a normal distribution for the oleic acid and linoleic acid. It was observed a strong negative correlation (-0.95) between oleic and linoleic acids. A negative correlation (-0.48) between protein and oil contents were also observed. Negative correlations among these compounds are common in soybean. The remaining correlations ranged from 0.01 to 0.29. By cluster analysis with the method of k-means, Euclidean distance and complete linkage, allowed the cut off level for the five linkage distance in the dendrogram (Fig. 1). The highest variability was found for protein (SD = 1.15) and for linoleic acid (SD = 1.10). In the Principal Component Analysis (PCA) was considered the first three eigenvalues greater than and equal to 1.0, which totalize 71.53% of the explained variance (PCA1 = 29.06, PCA2 = 23.76 and PCA3 = 18.71%). The highest average communality for these first three components were 0.99 for the oleic acid and 0.91 for the linoleic acid. It was observed that the response variables that most contributed to this study were the contents of protein, oleic acid and linoleic acid. Cultivars that responded for protein were 1 – MSBRS 169, 22- Campos Gerais , 30-IAC 1, 13-CEP 26, 26-FT Líder. For fatty acids the cultivars were 1-MS BRS 169, 2-FT Sarayba, 3-FT Guaira, 4-Ocepar 6, 5-FT Cometa, 6- Ocepar 13 and 7-BR 38. The fatty acids with low contribution were: palmitic acid and linolenic acid (Fig. 2). By using multivariate methods associated with the biplot, it was possible to indicate cultivars with higher levels of protein, oil and fatty acids. |
| Keywords: | Bioestatística |
| Type of Material: | Resumo em anais e proceedings |
| Access: | openAccess |
| Appears in Collections: | Resumo em anais de congresso (CNPSO) |
Files in This Item:
| File | Description | Size | Format | |
|---|---|---|---|---|
| Applicationofmultivariatemethodstoevaluatefattyacidsinsoybeancultivars.pdf | 59,16 kB | Adobe PDF | 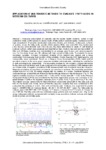 View/Open |


